
what went wrong?
There is no doubt that kangaroos were in trouble as soon as Europeans set foot on this continent – Charles Darwin’s observations of its disappearance from around the settlements, and the devastation from the English greyhounds were prophetic. Mitchell’s descriptions of the damage caused by the settlers, including over-running the countryside with stock, appropriating the best land and water, clearing of the forests and woods and destroying wildlife, are without doubt the mechanisms by which early declines were actuated. Since then their persecution has been unremitting, by a farming sector which seems to actually hate them.
7.1 Bad money
There can be no doubt that activities such as the meat/fur/skin trade, and commercialisation of the species, has brought about a critical situation with the large macropods. With enough funding, an industry can buy the “science” (and the scientists) it wants (for example the CSU researchers – Bergen 2011). The language used by “researchers” in discussing the harvest industry (“it’s sustainable”, for example) has created misconceptions in the general population, with an unquestioning media disseminating what can only be described as deliberately misleading information, put about by the pro-harvest sector.
For example McLeod (from the DPI Vertebrate Pest Unit) 2010 describes:
…between the years 2001-09 the population size of kangaroos in harvested areas ranged between 23.6 – 57.4 million
A subtle twisting of the fact, actually suggestive of a population increase. The population did not “range” between these values, it declined from a reported 57.4M in 2001 to only 23.6M in 2009.
As an addendum, several years of examining actual survey count data gained under Freedom of Information laws confirms that the publicly available "Population Estimates" bear no resemblance to the actual count data, and that survey and extrapolation methodologies have continued to 'increase' numbers of kangaroos beyond biological capacity and contrary to the facts of drought, industrial-scale shooting and reproductive capacity. See the supplementary submissions linked on the home page.
7.2 Bad “management”
Everywhere pro-harvest people talk about kangaroo “management”, when the only activity being conducted is the killing of animals. Simply killing stuff is not “management”; further the Kangaroo Management Advisory Committee is a misnomer – all they do is “manage” the harvest, indeed they are funded via fees collected for tag allocations.
7.3 Bad science
The Universities and other rusted on [and industry/government funded] researchers are comprehensively failing to provide adequate assessments or population estimates, with constantly changing methodologies and revision of correction factors, and an acknowledged high degree of “observer error”, with staggering and totally unacceptable error margins in all their research.
Barnes et al (1986) provides a damning critique of aerial survey methodologies, which remains unanswered to this day, while the flawed methodologies, which are widely cited, are:
…rarely questioned in scientific literature, and are now accepted and routinely used as a central component of broad-scale systematic kangaroo surveys over most of Australia.
Cairns et al do not provide the correction factors used in the 2004, 2007 and 2009 “reports” on kangaroos in the Northern Tablelands, Hunter and Central Tablelands commercial harvest zones. Instead Cairns has invented a new term (Pa), which indicates probability that a randomly selected object (in this case a kangaroo) within the survey strip is detected. Pa typically ranges between 0.24 and 0.49 (their Table 5), so the “correction factor” they are effectively applying (even if they are not calling it this) ranges between 2 and 4, in various habitats.
The Cairns reports look and sound like science, being full of very statistical looking equations and graphs, and big scientific sounding terms (the half-normal / cosine detection function, for example), and being for the most part incomprehensible to the layperson. But given that the defined “medium density” and “high density” areas of the harvest zones in their studies correspond to “areas of grazing and low intensity cropping” and “grazing land” respectively – exactly the land where kangaroo control and eradication programs occur, there is a very fundamental and critical flaw to their thinking. The regions where Cairns presumes “medium” and “high” density kangaroo populations are exactly the lands where their habitat has often been degraded (cleared or otherwise modified), and where kangaroos have been largely displaced by stock and agriculture, and the active suppression which accompanies it.
Case Study: Kangaroo monitoring
Let’s consider the data itself. Cairns 2007 and 2009 helpfully provides tables of animals counted, with length of transect, and whether they were in a “high” or “medium” density survey stratum.
In the Glen Innes region, Cairns flew 269.9 kms of “high” density stratum, with 670 Eastern Grey Kangaroos counted, and 36 Wallaroos, for a large macropod density of 2.6 macropods / km. Interestingly only a single transect had a high count (435 kangaroos and 17 wallaroos along a single 25 km transect – this EGK transect total exceeds all bar one of the total kangaroos observed in any stratum based survey area in either the 2007 or the 2009 surveys). This single transect represents 2/3 of the kangaroos counted for the Glen Innes “high” density stratum, and half the wallaroos. If this transect is discounted (it is a singular aberration statistically, and should have been discussed by Cairns, to be included in the data set at all), macropod density along the high density transects falls to only 1.04 / km. Yet Cairns does not discuss the aberrant transect data, instead using the kangaroos there to estimate the population occurring throughout their “high density” stratum, while 58% of their transects yielded less than one kangaroo / km, many “high density” transects provided less than ½ a kangaroo / km, and some high density transects provided only 0.1 kangaroos / km.
In the same region Cairns flew 182.96 kms of “medium” density stratum, with 277 Eastern Grey Kangaroos counted, and 13 Wallaroos, for a large macropod density of 1.58 kangaroos / km. None of the transects had statistically significant aberrations, so, if you discount the 435 kangaroos from the aberrant data set in the “high density” stratum, the “medium” density stratum actually has demonstrably higher densities of kangaroos than the “high” density stratum! Only 28.6km of transect in the “medium” stratum had densities of less than 1 kangaroo / km!
Clearly Cairns needs to swap around his “high” and “medium” density definitions, or perhaps it would make more sense to fly the transects, then map the low, medium and high density regions, based on the count data?
From these totals (944 Eastern Grey Kangaroos and 49 Wallaroos), and including the 435 kangaroos from the single transect (which creates a significantly skewed and positively biased data set), Cairns goes on to “calculate”, using “Pa” (a “detection probability” calculated for each observer, used instead of the conventional but controversial “correction factor”) populations of 236,600 Eastern Grey Kangaroos, and 32,184 Wallaroos in the Glen Innes area. That is: they saw 944 kangaroos (less than 1000 animals), they extrapolated this to suggest are over 200,000 of them (they multiplied observed animals by 250); they saw 49 Wallaroos, they extrapolated this to suggest there over 32,000 of them (they multiplied observed animals by 656).
In the Armidale region Cairns flew 179.7kms of “high” density stratum, with 168 Eastern Grey Kangaroos counted, and 9 Wallaroos, for a large macropod density of 0.93 kangaroos / km. Only 4 of 11 “high” density transects averaged more than 1 kangaroo / km; 3 of the 11 “high” density transects had no kangaroos.
In the same region Cairns flew 151.4 kms of “medium” density stratum, with 239 Eastern Grey Kangaroos counted, and 17 Wallaroos, for a large macropod density of 1.58 kangaroos / km of transect flown.
This is again a demonstrably higher density in the “medium” stratum, compared to the “high” density stratum! In addition only a single transect in the “medium” density stratum had less than 1 kangaroo / km, and this transect had no kangaroos at all. Clearly again, Cairns has his “high” and “medium” stratum contrariwise. It makes no sense to designate areas “High”, “Medium” and “Low” density strata, when the count data does not reflect these designations.
From these totals (407 Eastern Grey Kangaroos and 26 Wallaroos), Cairns works his wondrous mathematical / scientific magic, and comes up with populations of 141,610 Eastern Grey Kangaroos (they multiplied observed kangaroos by 348), and 37,859 Wallaroos. Incredibly they counted only 26 Wallaroos, but concluded that there are over 37,000 of them (they multiplied observed Wallaroos by a factor of 1,456).
In the Upper Hunter region Cairns flew 191.1 kms of “high” density stratum, with 336 Eastern Grey Kangaroos counted, and 94 Wallaroos, for a large macropod density of 2.25 kangaroos / km. In the same region Cairns flew 95.5 km of “medium” density stratum, with 77 Eastern Grey Kangaroos counted, and 12 Wallaroos, for a large macropod density of 0.93 kangaroos / km of transect flown. This smaller study area (less than a fifth in area of the Glen Innes or Armidale areas), and a higher proportional survey effort (266kms flown in the Upper Hunter, compared to 452.8km at Glen Innes and 331.1km at Armidale) may have been of adequate rigour to provide some basis for their stratification. It may simply be that the landholders of the Upper Hunter have just been more tolerant of kangaroos than landholders in the Glen Innes and Armidale regions.
Cairns acknowledges that often the number of sightings of animals were inadequate to calculate (estimate) populations, so he ended up pooling his high and medium density data sets in any event. Wallaroo sightings were so rare in the “medium” stratum in the Upper Hunter that he made population estimates for the zone “using only the data for the high density stratum”. That was probably a really good way to get a population of 44,923 Wallaroos, considering that he only counted 106 of them (multiplied by 423).
Note that Cairns uses in his (2007) Table 6 “191.1km” for transect (“effort”) length in the Upper Hunter, which is clearly very wrong; the total “effort” was actually 266.6kms (Cairns provided only the “high” density transects, and failed to add the “medium” transects). Any derivations thereof are therefore not correct, and the NPWS and KMAP basing any quotas on advice with these sort of errors will necessarily contain critical flaws.
Perhaps Cairns applies some unspecified attribute to differentiate the “high” from the “medium” density strata at Glen Innes and Armidale. Perhaps there are higher kangaroo densities in his “high” density stratum, compared to his “medium” density stratum, but the data does not show this. Cairns’ work in 2007 seems to contain many fundamental errors.
From the Cairns (2009) report:
With only 27 sightings of clusters of common wallaroos, nine sightings of red-necked wallabies and 24 sightings of swamp wallabies across all three proposed management zones (Table 4), there was insufficient data to determine reliable population and density estimates for these three species (pp 23)
To summarise Cairns et al “data” from 2009:
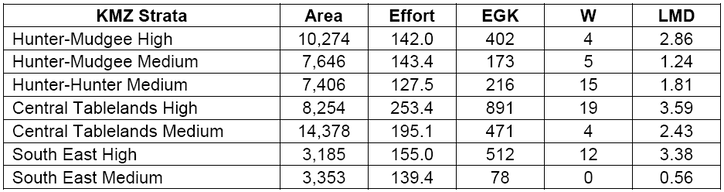
LMD is Large Macropods / km flown, providing a Large Macropod Density along transects. A simple measure, but with the “observer “detectability” profiles” being all similar (minor variations, same magnitude), these are comparable, even with the extremely poor 2007 data sets discussed above. In 2009 Cairns managed to obtain data (raw densities) which support the “high” and “medium” stratifications - perhaps after 2007 the team became better at identifying potential kangaroo habitat. Though perhaps the SE (medium) strata at 0.56 kangaroos / km should have been allocated a “low” strata designation.
Nonetheless alarming. Not even enough wallaroos to make a population estimate, even with their fantastic statistical models.
Major sections of regions defined as “low” density (ie: no kangaroos – not surveyed):
16% of the Hunter-Mudgee region is not suitable for kangaroos, this does not include coal-mining sections of the region, which were not surveyed.
Only 2% of the Central Tablelands is identified as “low” density habitat, however the Bathurst basin is identified as “high” density stratum. Consider finer scale mapping such as in Appendix 1, which provides that most of the Bathurst basin (roughly 450km²) is actually completely devoid of kangaroos (to which Cairns applied their “high density” quotient).
37% of South-east NSW is not suitable for kangaroos. One-third of this kangaroo harvest zone is completely devoid of kangaroos, so a quota of 98,000 kangaroos was set on the remainder.
Again simple errors in text: it was 17 transects in the Hunter-Mudgee High stratum, not 16, for example.
What was the University paid to run this “research” program and produce this nonsense, and who paid the University, and oversaw that the methods and data had rigour?
Cairns 2007 goes on to cite increases in Eastern Grey populations of up to 58% over three years (that is a rather impressive (if unlikely) average population growth rate of nearly 20% per annum during drought), and declines in Wallaroos between 2004 and 2007 by 43%, 48% and 27% (in 3 study regions), which is somehow not “statistically significant”. How can people who are supposed to be scientists suggest that a reduction by almost half in two study regions, and by more than a quarter in the third, in just 3 years (while acknowledging that these “changes in numbers would appear to be substantial”) is not significant? Does “z << 1.96; P> 0.05” somehow prove something the author does not understand about such a dramatic decline?
Hacker et al (2004) conducted a study which included the random sampling of kangaroos. 2,755 kangaroos were shot by the researchers. Further they accompanied professional shooters on commercial exercises and documented the demise of a further 718 animals. Were these “researchers” interested in kangaroo conservation, or harvesting?
While their research does have some very interesting data, it is unsurprising that they do not even consider anywhere that there is a case against harvesting – it was clearly a term of reference that they consider kangaroos within an ongoing harvest framework.
Case Study: The science of killing
Science has always been about killing. From Darwin or Wallace “collecting” specimens (even Orangutan), this was standard practice – it was inconceivable that nature’s bounty could ever be depleted by man.
Here we are 150 years later, with hundreds of extinctions worldwide and additional extinctions every day, and science on the whole has cleaned up its act (herpetologists and museums continue to be the exception). Animal Ethics Committees (ostensibly) oversee research, and make sure that using animals for science is done humanely, and with justification.
Somehow however, Hacker et al (2004) managed to convince their Ethics Committee that “randomly” shooting 2,755 kangaroos was justified (probably on statistical grounds – the larger the sample size, the more certainty there is in analysis of the data).
Hacker et al then went on to gouge out the eyes of the shot sample animals to determine ages of animals by weighing corneal lenses, because the usual way of determining age was impossible (heads of animals were often too damaged after shooting to measure maxilla (jawbone) length). They also accompanied professional shooters on their nightly sojourns, and did the same to these animals, as some carcasses (for market) needed their heads left on, and jaw measurement apparently requires the removal of the head.
If “humane shooting” is shots to the brain, why were maxilla being damaged by Hacker and his colleagues? Why were so many maxilla being damaged, that this was an impossible-to-use character of the carcasses for age determination? Obviously the number of damaged jawbones was statistically significant, for the “researchers” to discard the parameter. A statistically significant portion of animals were not shot according to the guidelines on humane dispatch of animals – they were shot through the head no doubt, and lay bleeding to death on the ground, while the “researchers” went on shooting.
1,126 pouch young were also destroyed. The ”researchers” aged pouch young separately, but did not include a description of their joey-euthanasia methodology. Did they bash them to death? Did they shoot them? Did they even need to kill them? As “researchers”, did they consider forwarding joeys to wildlife carers? In any event “humane” is supposed to be the least cruel method - in this instance, euthanasing via lethal injection should have been the preferred option for people considering themselves scientists.
7.4 Science under siege or science for $ale?
Something has definitely gone wrong with kangaroo management – particularly the counting. The author has no confidence in the veracity of data, and it is passing strange that no-one has ever questioned the absurd population monitoring data being reported.
Why? It may have something to do with an industry being able perhaps, to buy the science it wants. It may have something to do with departments being incapable of effectively delivering conservation outcomes, in the face of lobbying from a well-financed sector, and political interference. It may be that the kangaroo represents an unfortunate political target by rural and commercial kangaroo industries - with a coalition government always dependent on votes from that constituency, an opposition who would throw wildlife in front of a gun to collect those votes, and minor parties who don't want to make life difficult for themselves because it's too hard and they hope to collect the scraps of votes that might fall from the kangaroo-laden political table.
Banks et al (in prep) “Science Under Siege” will include a paper by Cooney et al “THINKK again: getting the facts straight on kangaroo harvesting and conservation”, which questions the impartiality of the UTS’s kangaroo workgroup THINKK, in their preparing papers advocating the curcease of the harvest industry, given their direct funding and close association with Voiceless, an animal welfare organisation.
It is instructive to note that Cooney is one of a number of academics who has been funded by the kangaroo industry to produce reports commissioned by the KIAA-directed RIRDC. This is an industry-led government entity providing research to support growth of the industry and to overcome market barriers (such as people's attitudes or market-messaging). It is co-funded by the KIAA and the Australian Government. Cooney is one of a group of scientists who regularly appear in the media promoting the shooting of kangaroos or tearing down questions about the shooting of kangaroos and the private business profiting from the mass slaughter of our native wildlife.
Interestingly, Cooney’s paper came to the attention of the author of this nomination via the Game Council, well prior to its release to the general public. Ms Cooney and her “conservation through sustainable use” (CSU) colleagues appear to have a close relationship with the pro-shooting community, despite their declaration otherwise. Perhaps their accusation of people being funded by interest sectors should be taken with a large grain of salt in case they may be exposed as perhaps having a perceived bias?
This nomination was funded by neither the harvest industry nor the animal welfare sector, in fact it was not funded at all. In the interest of maintaining impartiality, it seems fair for the author of this nomination to ask the same question of the pro-harvest “CSU researchers” as to what relationship or funding they have to the harvesting industry?
Certainly the commissioned research by the KIAA/RIRDC-Government partnership to grow the commercial kangaroo industry and overcome market barriers has benefited many publicly pro-commercial industry scientists who regularly fill the media with their attacks on concerns about the industrial-scale killing of native wildlife to profit business interests. Who else does the KIAA/Govt support and fund in various Universities with their fingers in the kangaroo pie? What funds come to the research and environmental sector via tag allocation or KIAA funding and commissioned research? Are the universities as industry consultants providing the right “science” bought for the right price?
Do universities need to satisfy the public that they are independent and ethical, by providing details of funding from corporate sector “partners”? If there has been any financial contribution from the kangaroo industry, even indirectly via funds from tag allocations to fund the long running “studies” on kangaroos across Australia, would their research pass a test as independent and impartial? Obviously the motivations of any researcher, the veracity of any data or report prepared, and the validity of any conclusions or recommendations provided, should be viewed in light of a possible conflict of interest (the term “cash for comment” springs to mind).
Science is certainly under siege – and it is most certainly for sale. The lack of faith the public has in the environmental impact assessment process is directly due to the ecological consultants who sign off every development as “no significant impact”. The lack of appreciation for the dire implications of global warming is similarly due to funded naysayers, communication campaigns, conflicted relationships and government lobbying by powerful vested interests in the fossil fuel sector; this also happened with tobacco. The author’s feeling is that the kangaroo management (harvest) “debate” has similarly been influenced by conflicted science masquerading as “research”.