how many kangaroos?
One of the problems with answering this very fundamental question is that it looks like no-one has really tried to figure it out yet.
Incredibly an average 3M kangaroos are allocated to quotas in Australia annually, and an unknown number are shot under s. 120 and s. 121 licences each year, and State and Federal “environment” and “conservation” departments do not even know how many kangaroos there are, or were.
Incredibly an average 3M kangaroos are allocated to quotas in Australia annually, and an unknown number are shot under s. 120 and s. 121 licences each year, and State and Federal “environment” and “conservation” departments do not even know how many kangaroos there are, or were.
4.1 Densities in National Parks & Reserves, and Other No-Shooting Areas
Pople & Grigg (1999) states as if it is an established truth (discussing populations in “protected” areas, such as National Parks):
It is worth noting that the dynamic and composition of many unharvested populations do not necessarily represent those of kangaroo populations prior to European settlement. Marked differences would be expected because of a combination of lower densities and predation by dingoes (see Chapter 3) and aboriginal hunters.
For the purposes of this nomination, impacts of dingos and aborigines prior to European invasion are considered to be negligible in comparison to what is going on now (see Myth Busting below), and Pople & Grigg’s position of “lower densities” historically is considered to be completely contrary to fact. In the absence of any quantitative account with which to marry the early explorers and settlers accounts of kangaroos being “abundant”, “plentiful”, “numerous” and “swarms”, kangaroo densities measured in National Parks and Nature Reserves are used in the calculations below to estimate numbers of animals that may have occurred in NSW prior to the advent of white man in Australia, and the transformation of landscapes which came with agricultural development.
The OEH do not have estimates of numbers of kangaroos occurring within the 7% of NSW which is reserved land (and in which kangaroos are “protected”). Even though much of the reserved land in NSW is along the east coast (and outside the commercial harvest zones), for the purposes of the calculations below the “7% Reserved” proportion has been applied uniformly across the State. This conservatively provides that 93% of the western zones is subject to harvesting; if less than 7% of the western (harvest) zone is “reserved” land (in which kangaroos are protected), a higher percentage of the wild-living population in western NSW will be subject to harvest and other shooting pressure.
The following “back-of-an-envelope” calculations may provide an indication of numbers historically, and presently. These figures have been provided not as exact or careful estimates, but to provide ballpark figures, and to “stimulate discussion”.
4.2 Total Western Grey Kangaroos
The simplest arithmetic on figures (matching Harvest Zones to WGK distribution) provides that the range of the WGK equals c. 459 357 km² in NSW.
Using the “7%” protected area figure from the DECCW CKHMP 2007, it is estimated that the WGK is “protected” within its natural range in only 32 155 km² in NSW.
Estimates of WGK density in “natural” environments has been calculated for a number of populations:
For the purposes of the calculations below, given extremely low densities of kangaroos elsewhere in Victoria (see below), Short and Griggs density calculations (see s. 4.10 Kangaroos in Other States and Territories) have been discarded. One hopes that kangaroos in protected areas in Victoria may be recovering from previously high rates of attrition, resulting from previously widespread and intensive eradication programs.
Using the “7%” protected area figure from the DECCW CKHMP 2007, it is estimated that the WGK is “protected” within its natural range in only 32 155 km² in NSW.
Estimates of WGK density in “natural” environments has been calculated for a number of populations:
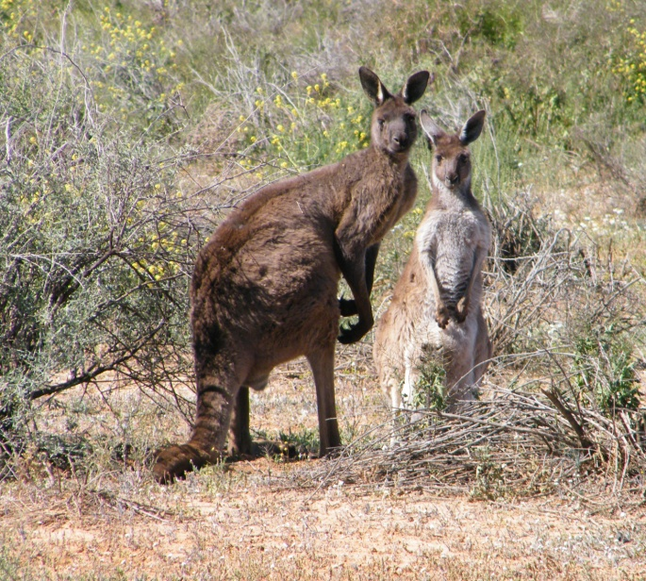
- Wandoo Woodland (Arnold et al 1991) stable at about 66 kangaroos / km² (based on a stable population of around 200 individuals occupying a 305ha remnant)
- Hattah-Kulkyne/Murray-Kulkyne VIC (Short & Grigg 1982): 18.12 (± 2.80)
- Wyperfield-Lake Albacutya VIC (Short & Grigg 1982): 1.62 (± 0.50)
- Pink Lakes VIC (Short & Grigg 1982): 2.13 (± 0.96)
- Little Desert VIC (Short & Grigg 1982): 0.18 (± 0.06)
For the purposes of the calculations below, given extremely low densities of kangaroos elsewhere in Victoria (see below), Short and Griggs density calculations (see s. 4.10 Kangaroos in Other States and Territories) have been discarded. One hopes that kangaroos in protected areas in Victoria may be recovering from previously high rates of attrition, resulting from previously widespread and intensive eradication programs.
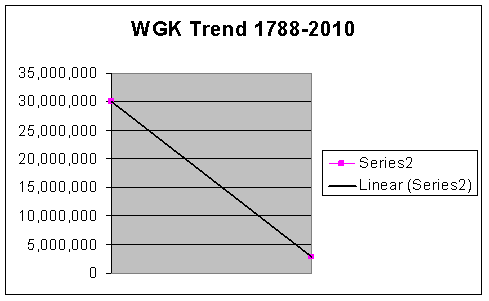
Historic: While Cairns & Gilroy (2001) describe the varying grey kangaroo proportions in the “overlap” zone of western NSW, for simplicity’s sake this nomination assumes that the 66 kangaroos / km² density occurred across their entire range in western NSW prior to European modification of the western zones for agriculture (based on Arnold et al 1991). If this was the case, the population of Western Grey Kangaroos in NSW prior to the advent of farming could have been as high as 30M kangaroos.
Present: Western Grey Kangaroo (M. fuliginosus): between 0.64M and 0.8M (DECCW 2009 est. 755 225) at densities of 1.49/km². Again, assuming densities of 66 kangaroos / km² persist in “unharvested (protected) areas”, reserved land could be supporting up to 2.1M Western Grey Kangaroos.
Estimated Total Western Grey Kangaroos in NSW, 2010: 2.8M.
The present population may represent as little as 9.3% of the original population.
KMZs: Within the KMZ’s, the original population is estimated to have been c. 28.2M. (assuming 93% of the area supported 93% of the population). The 722 255 estimated in the 2009 census indicates that as little as 2.6% of Western Grey Kangaroos may remain within the lands subject to harvesting. That is: across 93% of their range, 97.4% of Western Grey Kangaroos may be gone.
4.3 Total Red Kangaroos
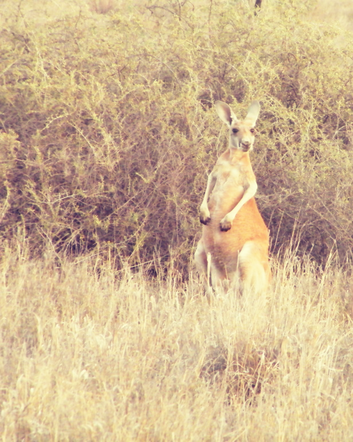
Again matching Harvest Zone areas to the distribution of the Red Kangaroo, we can calculate that the range of Red Kangaroos covers approximately 523 045 km² of NSW. Using the 7% protected area figure from the DECCW CHKMP 2007, it is estimated that the RK is protected within its natural range in NSW in only 36 613 km².
- Hattah-Kulkyne / Murray-Kulkyne VIC (Short & Grigg 1982): 0.77 (± 0.24) – note this park's population was estimated to be only 380 individuals (± 120)
- Pink Lakes VIC (Short & Grigg 1982): 0.13 (± 0.14) – note this park's population was estimated to be only 60 animals (± 70)
- Kinchega NP (Short & Bayliss 1985): 78 / km²
As for the reasons below (s. 4.10 Kangaroos in Other States and Territories), Short & Griggs (Victorian) densities have been discarded. For the purposes of this nomination (despite the “risk” of “inaccuracies” in aerial survey density estimates) Short and Bayliss’ 1985 density of 78 kangaroos / km² has been used for the following calculations.
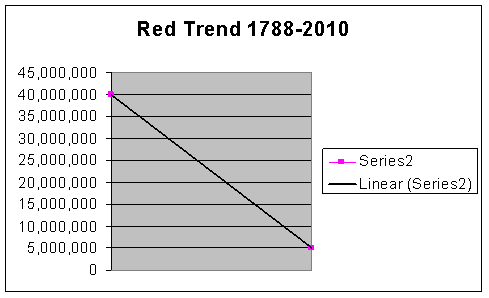
Historic: Given a distribution covering 500,000+ km², densities in Kinchega NP indicate that there may have been up to 40M Red Kangaroos through western NSW prior to the advent of farming.
Present: Red Kangaroo (M rufus): between 2.29M and 2.63M at densities of 4.58/km² (DECCW 2009 est. 2,456,795). Again assuming densities of 78 kangaroos / km² persist in “unharvested (protected) areas”, reserved land could still be supporting up to 2.8M Red Kangaroos.
Estimated Total Red Kangaroos in NSW, 2010: 5.2M.
The present population may represent as little as 13% of the original population.
KMZs: Within the KMZ’s, the original (pre-European) population is estimated to have been c. 37.2M (assuming 93% of the area supported 93% of the population). The 2.4M estimated in the 2009 census indicates that as little as 6% of Red Kangaroos remain within the lands subject to harvesting. That is: across 93% of their range, 94% of Red Kangaroos may be gone.
4.4 Total Eastern Grey Kangaroos
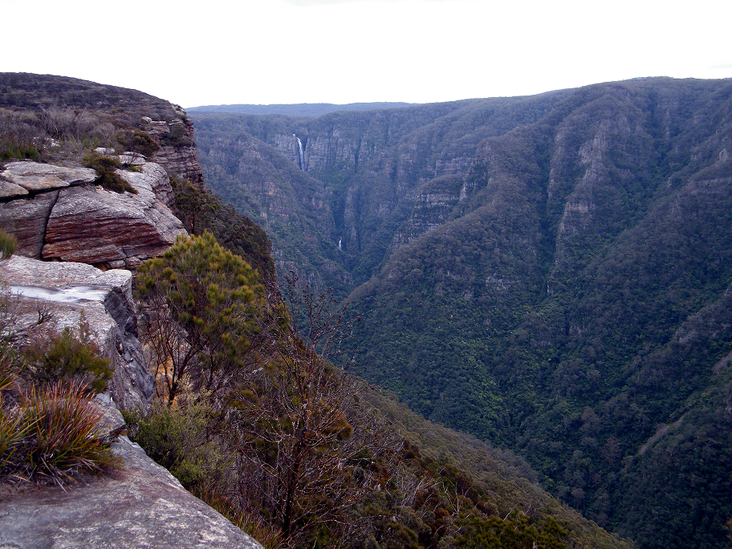
The Eastern Grey Kangaroo is given (by Strahan 1995, for example) to have occurred across the whole of the state (802,000 km²). There are regions however where Eastern Grey Kangaroos do not and probably have never occurred, for example the poorer forests on high sandstone plateaus, such as the escarpment country of the Blue Mountains (Kanangra Gorge pictured below), and the Hawkesbury and Illawarra regions, or wetland, rainforest, dunefield etc.
Further Eastern Grey Kangaroos have been reported to have been “expanding” their range at a rate of about 5km per annum into far western NSW (Caughley 1984), while simultaneously their distribution and the “overlap zone” was mapped all the way to the western border.
For the purposes of this nomination the Eastern Grey Kangaroo’s former distribution through NSW is considered to be the entire commercial harvest zone (656,907 km²), and 2/3 of the remaining eastern coastal and hinterland regions (97,212 km²). Total range in NSW (prior to the advent of farming): 754,119 km².
Estimates of EGK density in “natural” environments has been calculated for a number of populations:
Historic: The data from Victoria is discarded for the reasons outlined below (Kangaroos in Other States & Territories). Even then, there is wide variance between the estimated densities of kangaroos in natural areas. 74 / km² at Bathurst is far less than the 233 / km² recorded for the Reserves in the ACT, which is a lot less than the 450-510 / km² recorded in the Southern Tablelands (the author has not reviewed the methodology used in all of these studies, and is simply here citing density figures in the public domain). For the purposes of this nomination, the Committee should consider the following density estimates.
74 / km². This population density from Bathurst’s Mount Panorama is highly questionable, not least on the basis of the release of animals from an enclosure on the Mount (Sir Joseph Banks Nature Park), fifteen years or so ago. Lower densities may be applicable through the west of NSW, where environments are increasingly arid, and where the Eastern Greys overlap with Western Greys (see Caughley 1984 and Gilroy 2003).
233 / km². Averaged across a number of national parks over a few years, this figure has good rigour, however again, questions about varying densities in clines across NSW are likely to apply, in response to varying climatic conditions, and increasing competition with other large macropod species. Interestingly and perhaps pertinently, the ACT Parks and Conservation culling program in Tidbinbilla aimed to achieve densities of 200 / km² in this conservation area.
450-510 / km². Very high density, perhaps indicating optimal habitats.
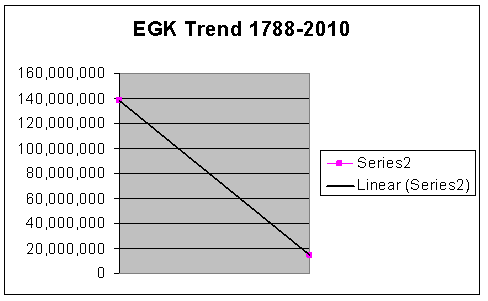
The author’s preference is for a clinal density change across the range of the Eastern Grey Kangaroo in NSW in pre-European times, in response to more arid conditions in the interior, and increasing competition from others of the large macropods. This nomination’s historic population estimate therefore applies 74 / km² to the western half of the population (giving 30M animals); 233 / km² to 40% of their range (giving c. 70M animals), and 510 / km² for 10% of the species range which may have been “optimal” habitat (giving 38M animals). Total: 138M.
Present: Numbers of Eastern Grey Kangaroos within the harvest zone are estimated to be 3.9M (DECCW 2009). Within the 7% “protected” areas in this region (45,984 km²), and using the clinal density calculation above, there may be 8.3M Eastern Grey Kangaroos within the Reserve system here also.
Previously 2/3 of the remaining (non-harvest) coastal fringe has been given as potential habitat. This nomination submits that at least 50% of this will have been lost to development, and the lost bits will have been the “better” bits (developed as farms and population centres). 14% of the remaining region will be reserved land (@ 233 / km²): 1.6M. The author has applied a density of 20 / km² to the remaining east-coast portion of the state, reflecting estimated densities for the Central Tablelands in settled rural areas, prior to harvest commencing (DECCW 2009): 0.8M.
Estimated Total Eastern Grey Kangaroos in NSW, 2010: 14.6M.
The present population may represent as little as 11% of the original population.
KMZs: Within the KMZ’s, the original (pre-European) population is here estimated to have been c. 109M. The 3.9M estimated as remaining in harvest areas in the 2009 census indicates that as little as 3.5% of Eastern Grey Kangaroos remain within the lands subject to harvesting.
Non-Harvest Zone: Within the non-harvest zones, the pre-European population is here estimated to have been c. 29M, with one third of the region being categorised as unsuitable habitat (on account of vegetation types and topography) for the Eastern Grey Kangaroo.
Development of the east coast has been extensive, estimates of the area that has been development are hard to make, but growth in this zone is about 2% per annum (averaged nationally according to NSCT 2005). This nomination presumes an optimistic maximum of 50% of potential habitat for the Eastern Grey Kangaroo has been substantially or completely modified by human development in the coastal zones.
2.4M kangaroos are here estimated as remaining in the non-harvest coastal zones of NSW; this may represent as little as only 8% of the kangaroos which may formerly have occurred here.
For the purposes of this nomination the Eastern Grey Kangaroo’s former distribution through NSW is considered to be the entire commercial harvest zone (656,907 km²), and 2/3 of the remaining eastern coastal and hinterland regions (97,212 km²). Total range in NSW (prior to the advent of farming): 754,119 km².
Estimates of EGK density in “natural” environments has been calculated for a number of populations:
- Reefs Hill Regional Park VIC (Meers & Adams 2008) approximately 38 / km²
- ACT Parks & Conservation Service (1996) 1995: 233 / km² “on nature reserves”
- ACT Parks & Conservation Service (1997) 1996: 236 / km² “on nature reserves”
- ACT Parks & Conservation Service (1997) 1996: 246 / km² “on nature reserves”
- ACT Parks & Conservation Service (1997) 1995: 357 / km² in Tidbinbilla NR
- ACT Parks & Conservation Service (1997) 1997: 367 / km² in Tidbinbilla NR
- Fletcher DB (2006) gives 450-510 / km² in the Southern Tablelands of NSW (the “highest densities of any kangaroo populations”)
- This nomination has calculated the Eastern Grey Kangaroos at Mount Panorama (prior to cull) as 74 / km² in the areas where counts could be matched to Lot sizes (see Appendix 1).
Historic: The data from Victoria is discarded for the reasons outlined below (Kangaroos in Other States & Territories). Even then, there is wide variance between the estimated densities of kangaroos in natural areas. 74 / km² at Bathurst is far less than the 233 / km² recorded for the Reserves in the ACT, which is a lot less than the 450-510 / km² recorded in the Southern Tablelands (the author has not reviewed the methodology used in all of these studies, and is simply here citing density figures in the public domain). For the purposes of this nomination, the Committee should consider the following density estimates.
74 / km². This population density from Bathurst’s Mount Panorama is highly questionable, not least on the basis of the release of animals from an enclosure on the Mount (Sir Joseph Banks Nature Park), fifteen years or so ago. Lower densities may be applicable through the west of NSW, where environments are increasingly arid, and where the Eastern Greys overlap with Western Greys (see Caughley 1984 and Gilroy 2003).
233 / km². Averaged across a number of national parks over a few years, this figure has good rigour, however again, questions about varying densities in clines across NSW are likely to apply, in response to varying climatic conditions, and increasing competition with other large macropod species. Interestingly and perhaps pertinently, the ACT Parks and Conservation culling program in Tidbinbilla aimed to achieve densities of 200 / km² in this conservation area.
450-510 / km². Very high density, perhaps indicating optimal habitats.
The author’s preference is for a clinal density change across the range of the Eastern Grey Kangaroo in NSW in pre-European times, in response to more arid conditions in the interior, and increasing competition from others of the large macropods. This nomination’s historic population estimate therefore applies 74 / km² to the western half of the population (giving 30M animals); 233 / km² to 40% of their range (giving c. 70M animals), and 510 / km² for 10% of the species range which may have been “optimal” habitat (giving 38M animals). Total: 138M.
Present: Numbers of Eastern Grey Kangaroos within the harvest zone are estimated to be 3.9M (DECCW 2009). Within the 7% “protected” areas in this region (45,984 km²), and using the clinal density calculation above, there may be 8.3M Eastern Grey Kangaroos within the Reserve system here also.
Previously 2/3 of the remaining (non-harvest) coastal fringe has been given as potential habitat. This nomination submits that at least 50% of this will have been lost to development, and the lost bits will have been the “better” bits (developed as farms and population centres). 14% of the remaining region will be reserved land (@ 233 / km²): 1.6M. The author has applied a density of 20 / km² to the remaining east-coast portion of the state, reflecting estimated densities for the Central Tablelands in settled rural areas, prior to harvest commencing (DECCW 2009): 0.8M.
Estimated Total Eastern Grey Kangaroos in NSW, 2010: 14.6M.
The present population may represent as little as 11% of the original population.
KMZs: Within the KMZ’s, the original (pre-European) population is here estimated to have been c. 109M. The 3.9M estimated as remaining in harvest areas in the 2009 census indicates that as little as 3.5% of Eastern Grey Kangaroos remain within the lands subject to harvesting.
Non-Harvest Zone: Within the non-harvest zones, the pre-European population is here estimated to have been c. 29M, with one third of the region being categorised as unsuitable habitat (on account of vegetation types and topography) for the Eastern Grey Kangaroo.
Development of the east coast has been extensive, estimates of the area that has been development are hard to make, but growth in this zone is about 2% per annum (averaged nationally according to NSCT 2005). This nomination presumes an optimistic maximum of 50% of potential habitat for the Eastern Grey Kangaroo has been substantially or completely modified by human development in the coastal zones.
2.4M kangaroos are here estimated as remaining in the non-harvest coastal zones of NSW; this may represent as little as only 8% of the kangaroos which may formerly have occurred here.
4.5 Total Wallaroos (also the “Euro”)
The Wallaroo is given to have occurred across NSW, however Strahan (1995) identifies a region in the south in which they are now extinct. Their habitat is given as rocky hills and rises, however, which does not extend to all landscapes across the State, however young males are known to disperse widely at independence (pers obs and Dawson 1995).
For the purposes of this nomination, 30% of the state is deemed to be optimal (hilly) habitat (ie: 240,600km²).
Estimates of Wallaroo densities have been provided for a range of situations:
For the purposes of this nomination, 30% of the state is deemed to be optimal (hilly) habitat (ie: 240,600km²).
Estimates of Wallaroo densities have been provided for a range of situations:
- Up to 13 / km² (Australian Museum 1983)
- 2.23-18.31 / km² (Clancy & Croft 1992)
- 3.48-19.99 / km² (Clancy & Croft 1992)
- Up to 45 / km² (Lundie-Jenkins et al undated)
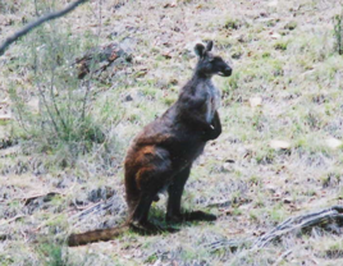
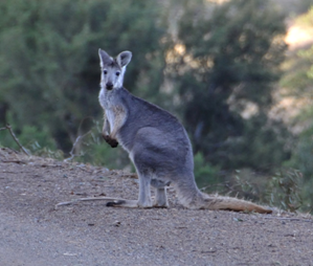
There is a high degree of sexual dimorphism in the Wallaroo (male left, female to the right) Photos: Tim Bergen
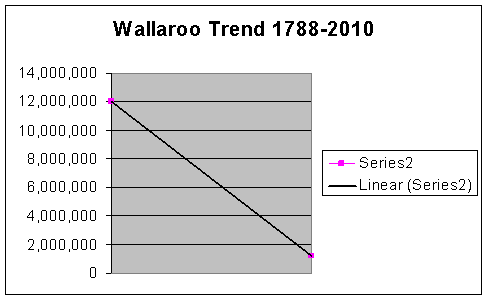
Historic: In the absence of any rigorous studies into Wallaroo densities in national parks and reserves, the high end of observed Wallaroo densities (45 / km²) is deemed to represent pre-European densities in optimal habitat areas (this provides an estimate of 10.8M), low densities (2.23 / km²) across the remaining (intervening low-quality habitats) provides potentially for a further 1.2M. Estimated Total Wallaroos 1778: 12M.
Present: The Wallaroo presents unique problems in estimating present numbers, as they are not counted or included in the harvest in any zones other than KMZ 9, KMZ 13, KMZ 14 and South-eastern NSW (an area of only 51,862 km²), so there is very little data for the species through much of their range.
Within KMZs however, in 2009 there were estimated to be 114,966 animals (see boxed text below). Protected areas (7% - only c. 3,630 km²) may provide harbour for up to 72,000 more (calculated using an average 20 / km² as a mid-range density estimate, at the top end of Clancy & Croft 1992).
Raw data from Cairns et al (2009) provides that Eastern Grey Kangaroos are 46 times more abundant than Wallaroos in simple terms (pure counted data). Very few sightings of Wallaroos (only 27 “clusters” observed) provided that “there was insufficient data to determine reliable population and density estimates” for this species. Nonetheless DECCW forged ahead without even obtaining an accurate estimate of the population, and authorised harvesting of Wallaroos at 15% quotas, while population estimates crashed from hundreds of thousands, to only a few tens of thousands (according to DECCW 2011).
Unfortunately female Wallaroos are superficially similar to Eastern Grey Kangaroos, and inland forms (the Euro) can be red (and could feasibly be mistaken for Red Kangaroos, particularly in the dark, or at distance). The Euro (subspecies erubescens) is not supposed to be included in the quota. The KMP minutes (November 2007) provides:
340 carcasses have been seized relating to untagged and incorrect species.
Four Court matters are pending. One for incorrect species – 160 seized in one chiller alone.
While the KMAP minutes do not specify what species are being illegally shot by harvesters, it is considered likely that Wallaroos / Euros will form part of the harvest even in areas where they are not supposed to, and farmers can obtain s. 120 and s. 121 licences to shoot them as well. This nomination does not presume that Wallaroos / Euros persist at pre-European densities through their former range, where they are not officially part of the take. The author suspects that Wallaroos (particularly Euros) will have been included in the harvest, wherever they occur.
In the interest of coming up with an estimate, this nomination applies the average density for Wallaroos as measured within the authorised KMZ’s (2.3 / km²), across 93% of its estimated habitat area through the rest of the KMZ’s (120,575 km²), giving 277,322 animals. Populations remaining in the 7% of the harvest area where they are protected (15,720 km²) was calculated at 20 / km², giving 181,520 animals. Densities in the intervening (poor habitat) regions are assumed for the purposes of this nomination to be approaching 0 / km² (as with macropods in the Victorian agricultural belt).
The non-harvest portions of the State are presumed for the purposes of this nomination to be relatively intact with regard to retention of this species habitat (one third of the region again, being c. 43,528 km²); one third of this habitat is estimated to have been destroyed by development or effectively occupied by humans, leaving c. 30,500 km² as utilised habitat. Application of the mid-range density (c. 20 / km²) provides that the east coast may provide harbour for as many as 610,000 animals. Again densities in the intervening (poor habitat) regions (where development has often occurred) are assumed for the purposes of this nomination to be approaching 0 / km².
Estimated Total Wallaroos in NSW, 2010: 1.2M
The present population may represent as little as 10% of the original population.
KMZs: Within the KMZs, the original (pre-European) population is here estimated to have been c. 9.8M. The 645,000 estimated as remaining in harvest areas indicates that as little as 7% of Wallaroos may remain in western NSW.
Non-Harvest Zone: Within the non-harvest zones, the pre-European population is here estimated to have been c. 2.2M. Development of the east coast has been extensive, estimates suggest that the coastal zones of Australia are being “developed” at a rate of 2% (growth) per year; NSW coastal zones growth rate is given as around 1.3% / year (NSCF 2005). This nomination presumes an optimistic maximum of 30% of Wallaroo habitat having been completely modified by human development. 610,000 Wallaroos remaining in the non-harvest zones of NSW may represent up to 30% of Wallaroos which would formerly have occurred here, prior to the advent of white man.
4.6 Summary of Large Macropod Population Estimates for NSW, 1788 - 2010
4.7 Limitations to the Pre-European & Present- Population Estimates Above
Figures in the table above are indicative at best only of orders of magnitude, based on best-guesses, and very poor data sets. It has been produced simply to generate some sort of figures for population estimates, and to stimulate discussion, if you like. Everyone else should feel free to have a go at calculating their own “historic” and “present-day” population estimates if they feel like it.
This nomination’s calculations rather simplistically suggest things like that of the “non-harvest” portion of the state (the east coast and Wagga Wagga regions), a proportion of potential habitats could be 1/3 completely modified by humans (and uninhabited by kangaroos), 1/3 uninhabitable on account of landform / vegetation, and 1/3 habitable to kangaroos. This is completely arbitrary, and it is hopefully conservative. There is no-way that 1/3 of the Wagga region remains inhabited by kangaroos (pers obs).
This nomination’s calculations rather simplistically suggest things like that of the “non-harvest” portion of the state (the east coast and Wagga Wagga regions), a proportion of potential habitats could be 1/3 completely modified by humans (and uninhabited by kangaroos), 1/3 uninhabitable on account of landform / vegetation, and 1/3 habitable to kangaroos. This is completely arbitrary, and it is hopefully conservative. There is no-way that 1/3 of the Wagga region remains inhabited by kangaroos (pers obs).
4.8 Put It On Your To Do List
It would be useful to calculate the following figures, to describe “lost” macropod habitat in NSW. The author does not have time to research these figures, much as he would like to.
Outside the commercial harvest zone, an area totalling xxxx km² of potential habitat occurs along the east coast and ranges.
Sydney sprawls across xxxx km², it spreads at a rate of about 500m per year (c. 50km “stellar” growth between 1909 and 2005 according to Barton 2007). It is estimated that xxxx km² of the coastal fringe has been lost to development (including cities such as Newcastle, Wollongong, Nowra, Gosford, Port Macquarie, Coffs Harbour and Grafton, as well as hundreds of smaller towns and villages); the NSCT (2005) provides that coastal growth runs at around 2% per annum. That’s why we have SEPP71 (Coastal Protection) in NSW.
In the east there are xxxx towns with populations between xxxx to xxxx. An average urban footprint of xxkm² has been allocated to each of these towns, this represents xxxx km², or xxxx% of the non-harvest zone.
Mining in the Hunter and elsewhere in the east of the State accounts for another xx% of the non-harvest portion of the state, at xxxx km².
Across the rest of the state (central and inland harvest zones) major population centres and the heavily modified environments surrounding them, such as Bathurst, Broken Hill, Orange, Dubbo, Mudgee, Wellington, Mussellbrook, Young, Wagga Wagga etc etc, should have wide “kangaroos excluded or extinct” zones, where the intensity of development has effectively removed them from the landscape.
An arbitrary figure of 100m as an exclusion zone can be allocated to xxx,xxx occupied residential envelopes (farm houses / lifestyle dwellings), totalling xxxx km² across NSW. Sympathetic landholders may have kangaroos within 100m of their house, however there is a simple aversion kangaroos have for humans (unsurprisingly), and hostile landholders may not have kangaroos for many kilometres, around their homes.
There are xxxx kms of roads within the non-harvest region; statewide there are xxx,xxx kms of road. Allocating roads a minimum kangaroo exclusion width of 22m (a fairly typical rural road, including the road reserve), provides that xxkm² across the western (harvest) zones actively contributes to loss of kangaroos by direct mortality throughout the regions in which they occur, often bisecting and further fragmenting kangaroo populations. The area in which kangaroo populations will struggle to persist (in proximity to roads) can be conservatively estimated to be at least 50m, on each side of the road.
There are xxxx registered primary producers, including chicken farms, market gardens, dairies, boutique markets (goats cheese, fancy cow etc), orchards, vineyards etc. Allocating an average area to these enterprises of xxxx ha per farm provides that a further xxxx km² of the State excludes kangaroos. Many of these landholders actively suppress (kill) or otherwise make properties uninhabitable to kangaroos (compound fences, no vegetation cover, intensive use and development).
In summary effectively xxxx% of the non-commercial harvest zone of NSW, and xxxx% of the state, has been rendered uninhabitable to kangaroos by cities and human residential development / occupancy, development of infrastructure (roads and rail), and other intensive development or unsympathetic land use.
Sandstone plateau and escarpment country is not optimal habitat for either the Wallaroo or the Eastern Grey Kangaroo (expect instead Swamp Wallabies, Red-necked Wallabies, and Brush-tailed Rock Wallabies). This unit is identified as a “low density stratum” in Cairns et al 2009 (and was not surveyed for kangaroos), it occurs extensively through the Blue Mountains and the Hunter, and south to Illawarra.
Note that properties adjacent to national parks and reserves frequently take up licences to cull, often citing “damage to fences” and “damage to crops” and on occasion it has been suggested that landholders may inflate numbers (pers comm NPWS Ranger - Bathurst). The complaint from land-holders? “NPWS breed ‘em”. Densities within national parks and reserves are assumed by this nomination to sometimes approach “normal” densities, however they would rarely be able to disperse safely or far across or into farmland.
4.9 Kangaroos Are Of Least Concern (IUCN Red List)
Auty (2004) quotes Hodgson (an early squatter from south-eastern Queensland):
It is a pitiable fact that in places where I have seen herds of 300 there is not one to be seen now.
When is the last time you saw a mob of 300 kangaroos?
Observed densities look to be less than one kangaroo / km² through much of central and western NSW (pers obs 2009), and the author considers that the estimated 23.8M total for 2010 is optimistic. Wallaroo estimates particularly will be subject to review if anyone ever does anything meaningful and rigorous with regard to population, density and distribution studies for this species through central and western NSW.
The following graphs represent trajectories of the four large macropods in NSW, since the arrival of white man.
You can drive through much of western NSW, particularly in the sheep / wheat belt, where you can see for kilometres in all directions, and there are large tracts which are completely devoid of kangaroos. This is similar to the situation described in north-western Victoria in Short & Grigg (1982), where densities were commonly less than 1 / km². You can see a lot of farms, on most of which there are guns, and where the landholders view, supported by the government authorities, is often that kangaroos are a pest to be eradicated. You can see miles of fences and roads, which also take a terrible toll on native wildlife.
Croft (2005):
How do we cope with the tourists’ lament that when drawn to the Australian wilderness and wildlife, they drive all day and never see a (live) kangaroo?
The tourists are not blind. The author conducted targeted (threatened flora) surveys through large sections of central western NSW in late 2009 (from Maude / Hay in the south to Mossgiel, Hillston, Lake Cargelligo and Euabalong in central NSW), where very low counts of macropods were noted as “opportunistic” records throughout (see Threatened Plants of Western NSW: Acacia curranii, Brachyscome papillosa & Leptorhynchus orientalis - Technical Report to Lachlan Catchment Management Authority Mjadwesch 2010).
You can target locations, generally reserved and public land, and see kangaroos – locals can generally direct “tourists” to locations where they can see kangaroos – even around Bathurst, NSW’s oldest inland city. You can find kangaroos here and there, and occasionally in populous pockets. What you can’t find are the mobs of hundreds of kangaroos the author knew as a child (1970’s-1980’s), and which could be found even as little as 10 years ago (pers obs at “High Rock”, west of Peak Hill in 2003).
Drummond (2008) provides:
According to the least squares exponential regression equation established using Eastern Grey Kangaroo population estimates, provided by the Australian Government DEWHA for the period 2001 to 2007, the number of eastern Grey Kangaroos in Australia will reduce from 30M in 2001 and 10M in 2007 to about 5M in 2010, 2M in 2015, and less than 1M in 2020, if the trend observed from 2001 to 2007 continues until 2020.
Are these sort of declines cause for alarm? Do these sort of predictions prompt the various state agencies to cease the harvest, and desist from issuing occupier’s licences (or their interstate equivalent)? Keep in mind the harvest quota is supposed to be “sustainable”. Keep in mind also that the “quota” (normally 15% or 17%, but sometimes as high as 30%), is not matched by “take”. These declines have been measured without harvesters even being able to make their quota, which common sense dictates they would certainly be attempting to do.
Hacker et al (2004), pro-harvest researcher, describes:
…reduction of kangaroos to very low densities (less than 5 / km²) over large areas is neither commercially feasible, ecologically defensible, nor economically justified...
...reduction of kangaroo densities to less than 5 kangaroos per square kilometer over large areas would result in the demise of the kangaroo industry
…minimum level for conservation (5 / km²)
…although the critical minimum density is not clearly defined, populations below 2 / km² would generally be considered at risk of extinction…
Yet densities of less than 5 / km² is where all species found themselves in many of the harvest zones in NSW in 2010. If species were not less than 5 / km², they were often close to or approaching this density throughout the western zones.
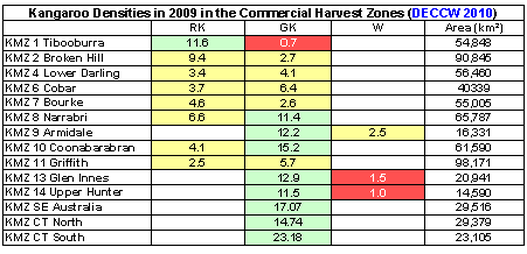
If you accept Pople and Grigg (1999) mapped densities of Red Kangaroos across Australia, with a “> 20 / km²” blob occupying much of KMZ 1, densities in KMZ 1 have halved in just 10 years.
If you accept Pople and Grigg (1999) mapped densities of Eastern Grey Kangaroos across Australia, with a “10-20 / km²” blob occupying much of KMZ 7, grey kangaroo densities have fallen to only 2.7 / km² (critically low) in only 10 years.
If you accept Pople and Grigg (1999) mapped densities of Western Grey Kangaroos across Australia, with a “10-20 / km²” blob occupying the central portion of KMZ 11: densities in KMZ 11 for Grey Kangaroos (ie: the addition of Eastern & Western Grey Kangaroos) are now at only 5.7 / km², after only 10 years.
Hacker et al (2004) & Hacker & McLeod (2008) optimistically recommend that populations can withstand a 20% quota, even though shooters can’t even make the 15% quota targets, and ignoring the fact of population growth being given as between 9 and 14% for the various species (discussed previously in this nomination). Even though populations have halved (or worse) in 10 years, and researchers have not even seen the impact of a 15% take, they describe the industry as sustainable.
When biological facts (such as reproductive rates and rates of juvenile mortality) are considered, and when the rates of ongoing harvest and “licensed” culling are considered (leaving aside illegal hunting, and the impacts of roads, fences and habitat loss), it is unsurprising that such declines are in evidence in the data, even of researchers attempting to support the harvest industry. Figures can’t be fudged far enough. It will be physically impossible for kangaroo numbers to return to their levels of even 10 years ago, unless researchers increase their “correction factors” again, or otherwise manipulate or “improve” their survey methodology and analyses.
4.10 Kangaroos in other States and Territories
ACT (Australia Capital Territory)
ACT Parks & Conservation Service 1996 provides 233 kangaroos / km² “on nature reserves”; with 1 484.28 km² of reserved land, plantations, forestry etc, there were an estimated 345 837 EGK in reserves / protected areas in the ACT in 1996
Estimated Total ACT Eastern Grey Kangaroos: 372 837 (1996)
These were alongside domestic animals (including cows, sheep and horses, but not including domestic or feral goats, or feral deer or rabbits), which had a DSE equal to 610 000 kangaroos in the ACT in 1996 (using Grigg's 2002 value of 1 kangaroo being 0.2 DSE). This gives the ACT a carrying capacity of 980 000 kangaroos.
However applying the 233 kangaroos/ km² “natural area density” to the rural lands of the ACT it would be estimated that in 1996 agriculture had reduced (displaced) the ACT kangaroo population to the tune of only c. 100 000 animals, indicating the region would only carry 470 000 kangaroos. This indicates a large discrepancy.
Applying standard herbage consumption as a measure of potential herbivore carrying capacity, 610 000 kangaroos have been displaced in the ACT by stock alone. Given kangaroo numbers present in 1996 (372 837), displacement by agriculture of 610 000 animals would equate much more closely with densities associated with those recorded in Tidbinbilla NR in 1996. 357 kangaroos / km² (over the entire ACT) would provide that there were 841 092 kangaroos in the ACT prior to the advent of farming, and development of the Canberra region – this is much closer to the livestock / kangaroo equivalent grazing in the ACT in 1996.
The ACT, without harvesting and with only 23% and 14% of the Territory being developed for rural and urban purposes respectively (ie: 67% “protected”), may have nonetheless by 1996 experienced a decline in kangaroo numbers (since settlement) of 56%.
- ACT Parks & Conservation Service 1996 provides 50 kangaroos / km² “on rural leases”; with 542 km² of rural land, there were an estimated 27 000 kangaroos on rural land in the ACT in 1996.
- ACT Parks & Conservation Service 1996 provides 0 kangaroos / km² for “urban land”
Estimated Total ACT Eastern Grey Kangaroos: 372 837 (1996)
These were alongside domestic animals (including cows, sheep and horses, but not including domestic or feral goats, or feral deer or rabbits), which had a DSE equal to 610 000 kangaroos in the ACT in 1996 (using Grigg's 2002 value of 1 kangaroo being 0.2 DSE). This gives the ACT a carrying capacity of 980 000 kangaroos.
However applying the 233 kangaroos/ km² “natural area density” to the rural lands of the ACT it would be estimated that in 1996 agriculture had reduced (displaced) the ACT kangaroo population to the tune of only c. 100 000 animals, indicating the region would only carry 470 000 kangaroos. This indicates a large discrepancy.
Applying standard herbage consumption as a measure of potential herbivore carrying capacity, 610 000 kangaroos have been displaced in the ACT by stock alone. Given kangaroo numbers present in 1996 (372 837), displacement by agriculture of 610 000 animals would equate much more closely with densities associated with those recorded in Tidbinbilla NR in 1996. 357 kangaroos / km² (over the entire ACT) would provide that there were 841 092 kangaroos in the ACT prior to the advent of farming, and development of the Canberra region – this is much closer to the livestock / kangaroo equivalent grazing in the ACT in 1996.
The ACT, without harvesting and with only 23% and 14% of the Territory being developed for rural and urban purposes respectively (ie: 67% “protected”), may have nonetheless by 1996 experienced a decline in kangaroo numbers (since settlement) of 56%.
South Australia & Victoria
1830s Jamieson [Mornington Peninsula]
…kangaroos were running literally in large herds
Short & Grigg conducted aerial surveys of south-eastern South Australia and north-western Victoria, across 133 000 km² of the wheat / pastoral zones in 1982, with four national parks counted for comparison. Surveys of these wheat / pastoral regions provided densities far lower than those reported for similar regions in NSW and South Australia previously.
For Red Kangaroos, Short & Grigg (1982) found that they:
…were recorded in only two of the degree blocks (Blocks 3 and 6; Table 1) covering an area from Mildura south through Hattah, Ouyen and Hopetown to Birchip. Densities in these two blocks averaged 0.15 per square kilometre, to give a total of 3000 ± 1000
Note that the “averaged” density above may have included animals counted within the parks / nature reserves occurring within the blocks; to get the “3000” total, animals counted within the parks may have been applied across a landscape otherwise largely devoid of kangaroos.
Red Kangaroos were observed on only two degree blocks in north-western Victoria, much of the surveyed area lying beyond their range in distribution. Reds occur to the west of these two grid squares (eg: in Pink Lakes State Park) but either at very low densities or in scattered patches such that they were missed by the low-intensity, scanning survey
So two parks contained Red Kangaroos in Victoria in 1982, and they numbered as low as 440 animals. Were they listed as threatened in Victoria? What is the Red Kangaroos’ status in Victoria now?
For Grey Kangaroos (which would previously have occurred across most of Victoria, with the possible exception of the harshest environments), Short & Grigg found that they were completely absent from 4 mapsheets in their study area. Where they did occur:
Grey Kangaroos were recorded at densities of less than 0.01 per square kilometre in 32% of the area surveyed. Of the total area, 85% had a density less than 1.0 per square kilometre.
Hacker et al defines these densities as “quasi-extinct” in 2004. “Quasi-extinction” is where “the nominal value of kangaroo densities is taken to be the effective loss of the species”.
[Harvest] strategies that produce average densities of less than five per square kilometre would result in minimum densities of less than two kangaroos per square kilometre and could be considered a threat to species conservation
Short & Grigg (1982) again: Such low densities seem to reflect the effects of intensive land use and the marginal nature for kangaroos of the remaining areas of natural vegetation…
The predominant form of land use in the area of survey is wheat-sheep farming, as against extensive grazing of sheep for wool in the pastoral areas of NSW and SA. Wheat farming is a highly mechanised form of land use requiring large paddocks with few trees. Shelter belts of natural vegetation between paddocks are usually lacking, and the only remaining stands of
natural vegetation are thin ribbons of trees along road verges. This represents poor habitat for grey kangaroos, which prefer ecotones where substantial areas of forest providing cover abut open grassy feeding grounds…
Reduced forest or scrub cover exposes kangaroos in these areas to the resulting control measures mounted by farmers…
The low density of kangaroos in cultivated areas, particularly wheat growing areas, appears to be a general phenomenon.
These densities are much closer to observable densities in western NSW at present (pers obs 2009). If 1 kangaroo / km² is the correct density in western NSW (instead of those listed in DECCW 2009, where densities range from to 1.7 (KMZ 1 Tibooburra) to 23.18 (Central Tablelands South KMZ), there could be as few as c. 650 000 Eastern Grey Kangaroos in NSW within the harvest areas. If this is the case it is no wonder shooters continue to fail to reach the quota allocated each year.
…kangaroos were running literally in large herds
Short & Grigg conducted aerial surveys of south-eastern South Australia and north-western Victoria, across 133 000 km² of the wheat / pastoral zones in 1982, with four national parks counted for comparison. Surveys of these wheat / pastoral regions provided densities far lower than those reported for similar regions in NSW and South Australia previously.
For Red Kangaroos, Short & Grigg (1982) found that they:
…were recorded in only two of the degree blocks (Blocks 3 and 6; Table 1) covering an area from Mildura south through Hattah, Ouyen and Hopetown to Birchip. Densities in these two blocks averaged 0.15 per square kilometre, to give a total of 3000 ± 1000
Note that the “averaged” density above may have included animals counted within the parks / nature reserves occurring within the blocks; to get the “3000” total, animals counted within the parks may have been applied across a landscape otherwise largely devoid of kangaroos.
Red Kangaroos were observed on only two degree blocks in north-western Victoria, much of the surveyed area lying beyond their range in distribution. Reds occur to the west of these two grid squares (eg: in Pink Lakes State Park) but either at very low densities or in scattered patches such that they were missed by the low-intensity, scanning survey
- Hattah-Kulkyne / Murray-Kulkyne VIC (Short & Grigg 1982): 0.77 (± 0.24) – note this park’s population was estimated to be only 380 individuals (± 120)
- Pink Lakes VIC (Short & Grigg 1982): 0.13 (± 0.14) – note this park’s population was estimated to be only 60 animals (± 70)
So two parks contained Red Kangaroos in Victoria in 1982, and they numbered as low as 440 animals. Were they listed as threatened in Victoria? What is the Red Kangaroos’ status in Victoria now?
For Grey Kangaroos (which would previously have occurred across most of Victoria, with the possible exception of the harshest environments), Short & Grigg found that they were completely absent from 4 mapsheets in their study area. Where they did occur:
Grey Kangaroos were recorded at densities of less than 0.01 per square kilometre in 32% of the area surveyed. Of the total area, 85% had a density less than 1.0 per square kilometre.
Hacker et al defines these densities as “quasi-extinct” in 2004. “Quasi-extinction” is where “the nominal value of kangaroo densities is taken to be the effective loss of the species”.
[Harvest] strategies that produce average densities of less than five per square kilometre would result in minimum densities of less than two kangaroos per square kilometre and could be considered a threat to species conservation
Short & Grigg (1982) again: Such low densities seem to reflect the effects of intensive land use and the marginal nature for kangaroos of the remaining areas of natural vegetation…
The predominant form of land use in the area of survey is wheat-sheep farming, as against extensive grazing of sheep for wool in the pastoral areas of NSW and SA. Wheat farming is a highly mechanised form of land use requiring large paddocks with few trees. Shelter belts of natural vegetation between paddocks are usually lacking, and the only remaining stands of
natural vegetation are thin ribbons of trees along road verges. This represents poor habitat for grey kangaroos, which prefer ecotones where substantial areas of forest providing cover abut open grassy feeding grounds…
Reduced forest or scrub cover exposes kangaroos in these areas to the resulting control measures mounted by farmers…
The low density of kangaroos in cultivated areas, particularly wheat growing areas, appears to be a general phenomenon.
These densities are much closer to observable densities in western NSW at present (pers obs 2009). If 1 kangaroo / km² is the correct density in western NSW (instead of those listed in DECCW 2009, where densities range from to 1.7 (KMZ 1 Tibooburra) to 23.18 (Central Tablelands South KMZ), there could be as few as c. 650 000 Eastern Grey Kangaroos in NSW within the harvest areas. If this is the case it is no wonder shooters continue to fail to reach the quota allocated each year.
Western Australia
(Dr Andrew Glikson – pers comm 2010)
The kangaroos, my years-long companions in the Pilbara, wherever we went into the hills there they were all around, but during 2006-2007 only few were to be seen.
Short et al (1983) provides an account of Red and Western Grey Kangaroos in Western Australia, where they claim to have surveyed “almost all” of the kangaroo’s range in the state. They found densities to be “much lower” than in the eastern states.
Reds Kangaroos maximum density: 4-5 / km², however across their range 73% of the area had densities of less than 1 / km² (“quasi-extinct” according to Hacker et al 2004).
Western Grey Kangaroo maximum density: 5-6-7 / km², however across their range 74% of the area had densities of less than 1 / km² (quasi-extinct according to Hacker et al 2004).
Even with these incredibly low densities, harvests of 13.6% and 7.8% of populations of Red and Western Grey Kangaroos were reported in 1981. How exactly do low densities regulate the industry? They will continue to shoot them as long as they can find them – if there are not many, they look harder, or work longer hours.
Queensland
(Tiffany Mason – pers comm 2010)
We travelled for 500 kilometres in the channel country [on a bird-guiding tour] and hardly saw any – I don’t think we would have seen 10.
ABC Rural (13.12.2010) interviewing the President of the Kangaroo Industry Association of Australia, Ray Borda, reported with regard to the Queensland kangaroo industry being brought “to a standstill” that:
…roos are hard to find because of the abundance of green feed… supply is down by 90%.
If we consider again the early explorers’ accounts of abundant wildlife and great herds of kangaroos, anyone saying that kangaroos are “hard to find” should be a cause for concern. Grasping at reasons such as the wider availability of feed may not necessarily be based in fact – they may be “hard to find” simply because there are fewer of them.
